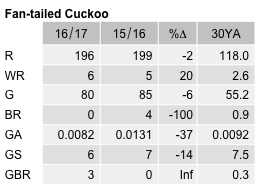
Fan-tailed Cuckoo
Cacomantis flabelliformis
ABR description
The following is extracted from the Annual Bird Report for the twelve months to June 2017.
Common, breeding summer migrant
Common and widespread throughout the region in spring and summer.
General: Record numbers the same as last year. Statistics are somewhat skewed by a single outlier record of 25 birds. Abundance is down 21% on last year and down 61% on the 30YA. Reporting rate is down 18% on last year and down 68% on the 30YA. Recorded in all seasons, with a peak in spring of 62%. Earliest record 1/19 Jul ANBG (McI3); latest, 1/18 Jun Devils Gap GrG18 (DaC1). No breeding records, 4 last year.
GBS: 17 records down from 35 records last year from 6 sites down from 7 sites last year. 11 records from Carwoola (BuM1). Abundance is down 37% on last year and down 11% on the 30YA. The reporting rate is down 45% on last year and down 24% on the 30YA. Earliest record: 1/4wk Aug Carwoola GrQ16 (BuM1); latest, 1/2wk Mar Ainslie (HoS1). 3 breeding records after 6 last year: earliest, di/4wk Aug and latest, di/3wk Nov both from Carwoola (BuM1).
Abundance
Abundance is the average number of birds of that species per survey. Where the species was observed (presence recorded) but the number of birds seen was not recorded, this is treated as a count of zero.
Abundance by year
This chart shows the abundance of Fan-tailed Cuckoo between 1982 and 2017. 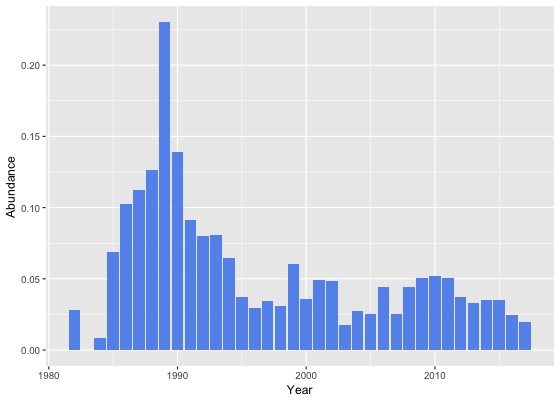
Abundance by month
This chart shows the monthly abundance of Fan-tailed Cuckoo. The blue lines show the abundance for the twelve months to June 2017 and the bars show the average abundance for the period 1982 to 2017. 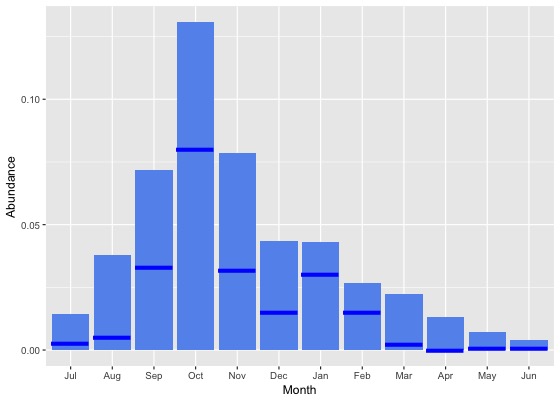
Abundance by season
This chart shows the seasonal abundance of Fan-tailed Cuckoo. The blue lines show the seasonal abundance for the twelve months to June 2017 and the bars show the average seasonal abundance for the period 1982 to 2017. 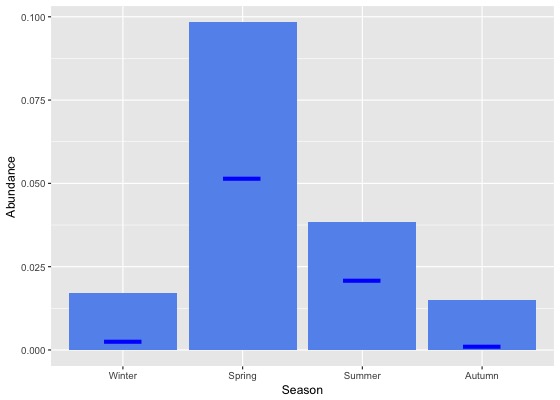
Abundance data
| Month | Season | ||||||||||||||||||
|---|---|---|---|---|---|---|---|---|---|---|---|---|---|---|---|---|---|---|---|
| Period | Jul | Aug | Sep | Oct | Nov | Dec | Jan | Feb | Mar | Apr | May | Jun | Winter | Spring | Summer | Autumn | All | ||
| All years | |||||||||||||||||||
| All | 0.0 | 0.0 | 0.1 | 0.1 | 0.1 | 0.0 | 0.0 | 0.0 | 0.0 | 0.0 | 0.0 | 0.0 | 0.0 | 0.1 | 0.0 | 0.0 | 0.0 | ||
| Previous years | |||||||||||||||||||
| All previous years | 0.0 | 0.0 | 0.1 | 0.1 | 0.1 | 0.0 | 0.0 | 0.0 | 0.0 | 0.0 | 0.0 | 0.0 | 0.0 | 0.1 | 0.0 | 0.0 | 0.1 | ||
| Previous 30 years | 0.0 | 0.0 | 0.1 | 0.1 | 0.1 | 0.0 | 0.0 | 0.0 | 0.0 | 0.0 | 0.0 | 0.0 | 0.0 | 0.1 | 0.0 | 0.0 | 0.1 | ||
| Previous 20 years | 0.0 | 0.0 | 0.1 | 0.1 | 0.0 | 0.0 | 0.0 | 0.0 | 0.0 | 0.0 | 0.0 | 0.0 | 0.0 | 0.1 | 0.0 | 0.0 | 0.0 | ||
| 10 year groups | |||||||||||||||||||
| [2007,2017) | 0.0 | 0.0 | 0.0 | 0.1 | 0.0 | 0.0 | 0.0 | 0.0 | 0.0 | 0.0 | 0.0 | 0.0 | 0.0 | 0.1 | 0.0 | 0.0 | 0.0 | ||
| [1997,2007) | 0.0 | 0.0 | 0.1 | 0.1 | 0.1 | 0.0 | 0.0 | 0.0 | 0.0 | 0.0 | 0.0 | 0.0 | 0.0 | 0.1 | 0.0 | 0.0 | 0.0 | ||
| [1987,1997) | 0.0 | 0.1 | 0.2 | 0.2 | 0.2 | 0.2 | 0.2 | 0.1 | 0.1 | 0.0 | 0.0 | 0.0 | 0.1 | 0.2 | 0.1 | 0.0 | 0.1 | ||
| 5 year groups | |||||||||||||||||||
| [2012,2017) | 0.0 | 0.0 | 0.0 | 0.1 | 0.0 | 0.0 | 0.0 | 0.0 | 0.0 | 0.0 | 0.0 | 0.0 | 0.0 | 0.1 | 0.0 | 0.0 | 0.0 | ||
| [2007,2012) | 0.0 | 0.0 | 0.1 | 0.1 | 0.0 | 0.0 | 0.0 | 0.0 | 0.0 | 0.0 | 0.0 | 0.0 | 0.0 | 0.1 | 0.0 | 0.0 | 0.0 | ||
| [2002,2007) | 0.0 | 0.0 | 0.1 | 0.1 | 0.1 | 0.0 | 0.0 | 0.0 | 0.0 | 0.0 | 0.0 | 0.0 | 0.0 | 0.1 | 0.0 | 0.0 | 0.0 | ||
| [1997,2002) | 0.0 | 0.0 | 0.1 | 0.1 | 0.1 | 0.0 | 0.0 | 0.0 | 0.0 | 0.0 | 0.0 | 0.0 | 0.0 | 0.1 | 0.0 | 0.0 | 0.0 | ||
| [1992,1997) | 0.0 | 0.0 | 0.1 | 0.1 | 0.1 | 0.1 | 0.1 | 0.0 | 0.0 | 0.0 | 0.0 | 0.0 | 0.0 | 0.1 | 0.1 | 0.0 | 0.1 | ||
| [1987,1992) | 0.0 | 0.1 | 0.2 | 0.3 | 0.3 | 0.2 | 0.2 | 0.1 | 0.1 | 0.0 | 0.0 | 0.0 | 0.1 | 0.3 | 0.2 | 0.1 | 0.1 | ||
| Year | |||||||||||||||||||
| 2017 | 0.0 | 0.0 | 0.0 | 0.1 | 0.0 | 0.0 | 0.0 | 0.0 | 0.0 | 0.0 | 0.0 | 0.0 | 0.0 | 0.1 | 0.0 | 0.0 | 0.0 | ||
| 2016 | 0.0 | 0.0 | 0.0 | 0.1 | 0.0 | 0.0 | 0.0 | 0.0 | 0.0 | 0.0 | 0.0 | 0.0 | 0.0 | 0.1 | 0.0 | 0.0 | 0.0 | ||
| 2015 | 0.0 | 0.0 | 0.1 | 0.1 | 0.0 | 0.0 | 0.0 | 0.0 | 0.0 | 0.0 | 0.0 | 0.0 | 0.0 | 0.1 | 0.0 | 0.0 | 0.0 | ||
| 2014 | 0.0 | 0.0 | 0.0 | 0.1 | 0.0 | 0.1 | 0.0 | 0.0 | 0.0 | 0.0 | 0.0 | 0.0 | 0.0 | 0.1 | 0.0 | 0.0 | 0.0 | ||
| 2013 | 0.0 | 0.0 | 0.0 | 0.1 | 0.0 | 0.0 | 0.0 | 0.0 | 0.0 | 0.0 | 0.0 | 0.0 | 0.0 | 0.1 | 0.0 | 0.0 | 0.0 | ||
| 2012 | 0.0 | 0.0 | 0.0 | 0.1 | 0.0 | 0.0 | 0.0 | 0.0 | 0.0 | 0.0 | 0.0 | 0.0 | 0.0 | 0.1 | 0.0 | 0.0 | 0.0 | ||
| 2011 | 0.0 | 0.1 | 0.1 | 0.2 | 0.0 | 0.0 | 0.0 | 0.1 | 0.0 | 0.0 | 0.0 | 0.0 | 0.0 | 0.1 | 0.0 | 0.0 | 0.1 | ||
| 2010 | 0.0 | 0.0 | 0.1 | 0.2 | 0.0 | 0.0 | 0.0 | 0.0 | 0.0 | 0.0 | 0.0 | 0.0 | 0.0 | 0.1 | 0.0 | 0.0 | 0.1 | ||
| 2009 | 0.0 | 0.0 | 0.0 | 0.1 | 0.1 | 0.0 | 0.0 | 0.1 | 0.0 | 0.0 | 0.0 | 0.0 | 0.0 | 0.1 | 0.0 | 0.0 | 0.1 | ||
| 2008 | 0.0 | 0.0 | 0.1 | 0.1 | 0.0 | 0.0 | 0.0 | 0.1 | 0.0 | 0.0 | 0.0 | 0.0 | 0.0 | 0.1 | 0.0 | 0.0 | 0.0 | ||
| 2007 | 0.0 | 0.0 | 0.1 | 0.1 | 0.0 | 0.0 | 0.0 | 0.0 | 0.0 | 0.0 | 0.0 | 0.0 | 0.0 | 0.1 | 0.0 | 0.0 | 0.0 | ||
| 2006 | 0.0 | 0.0 | 0.0 | 0.2 | 0.1 | 0.0 | 0.0 | 0.0 | 0.0 | 0.0 | 0.0 | 0.0 | 0.0 | 0.1 | 0.0 | 0.0 | 0.0 | ||
| 2005 | 0.0 | 0.0 | 0.0 | 0.0 | 0.1 | 0.1 | 0.0 | 0.0 | 0.0 | 0.0 | 0.0 | 0.0 | 0.0 | 0.0 | 0.0 | 0.0 | 0.0 | ||
| 2004 | 0.0 | 0.0 | 0.1 | 0.0 | 0.0 | 0.0 | 0.0 | 0.0 | 0.0 | 0.0 | 0.0 | 0.0 | 0.0 | 0.1 | 0.0 | 0.0 | 0.0 | ||
| 2003 | 0.0 | 0.0 | 0.0 | 0.1 | 0.0 | 0.0 | 0.0 | 0.0 | 0.0 | 0.0 | 0.0 | 0.0 | 0.0 | 0.0 | 0.0 | 0.0 | 0.0 | ||
| 2002 | 0.0 | 0.0 | 0.0 | 0.1 | 0.2 | 0.0 | 0.0 | 0.0 | 0.0 | 0.0 | 0.0 | 0.0 | 0.0 | 0.1 | 0.0 | 0.0 | 0.0 | ||
| 2001 | 0.0 | 0.0 | 0.1 | 0.2 | 0.1 | 0.0 | 0.0 | 0.0 | 0.0 | 0.0 | 0.0 | 0.0 | 0.0 | 0.1 | 0.0 | 0.0 | 0.0 | ||
| 2000 | 0.0 | 0.0 | 0.1 | 0.1 | 0.1 | 0.0 | 0.0 | 0.0 | 0.0 | 0.0 | 0.0 | 0.0 | 0.0 | 0.1 | 0.0 | 0.0 | 0.0 | ||
| 1999 | 0.0 | 0.1 | 0.1 | 0.1 | 0.2 | 0.0 | 0.1 | 0.0 | 0.0 | 0.0 | 0.0 | 0.0 | 0.0 | 0.2 | 0.0 | 0.0 | 0.1 | ||
| 1998 | 0.0 | 0.0 | 0.1 | 0.1 | 0.0 | 0.0 | 0.0 | 0.0 | 0.0 | 0.0 | 0.0 | 0.0 | 0.0 | 0.1 | 0.0 | 0.0 | 0.0 | ||
| 1997 | 0.1 | 0.1 | 0.0 | 0.1 | 0.0 | 0.0 | 0.0 | 0.0 | 0.0 | 0.0 | 0.0 | 0.0 | 0.1 | 0.0 | 0.0 | 0.0 | 0.0 | ||
| 1996 | 0.0 | 0.0 | 0.1 | 0.0 | 0.1 | 0.1 | 0.0 | 0.0 | 0.0 | 0.0 | 0.0 | 0.0 | 0.0 | 0.0 | 0.0 | 0.0 | 0.0 | ||
| 1995 | 0.0 | 0.0 | 0.0 | 0.0 | 0.1 | 0.1 | 0.0 | 0.0 | 0.0 | 0.0 | 0.0 | 0.0 | 0.0 | 0.1 | 0.0 | 0.0 | 0.0 | ||
| 1994 | 0.1 | 0.1 | 0.1 | 0.1 | 0.1 | 0.1 | 0.1 | 0.1 | 0.0 | 0.0 | 0.0 | 0.0 | 0.1 | 0.1 | 0.1 | 0.0 | 0.1 | ||
| 1993 | 0.0 | 0.1 | 0.2 | 0.1 | 0.2 | 0.0 | 0.3 | 0.0 | 0.0 | 0.0 | 0.0 | 0.0 | 0.0 | 0.2 | 0.1 | 0.0 | 0.1 | ||
| 1992 | 0.0 | 0.0 | 0.2 | 0.2 | 0.2 | 0.0 | 0.1 | 0.1 | 0.0 | 0.0 | 0.0 | 0.0 | 0.0 | 0.2 | 0.1 | 0.0 | 0.1 | ||
| 1991 | 0.0 | 0.1 | 0.1 | 0.1 | 0.3 | 0.1 | 0.1 | 0.1 | 0.0 | 0.0 | 0.0 | 0.0 | 0.1 | 0.2 | 0.1 | 0.0 | 0.1 | ||
| 1990 | 0.1 | 0.1 | 0.2 | 0.1 | 0.2 | 0.2 | 0.6 | 0.1 | 0.1 | 0.0 | 0.1 | 0.1 | 0.1 | 0.2 | 0.3 | 0.1 | 0.1 | ||
| 1989 | 0.0 | 0.2 | 0.4 | 0.4 | 0.3 | 0.4 | 0.3 | 0.1 | 0.2 | 0.1 | 0.1 | 0.0 | 0.1 | 0.4 | 0.3 | 0.1 | 0.2 | ||
| 1988 | 0.0 | 0.1 | 0.2 | 0.3 | 0.3 | 0.2 | 0.2 | 0.1 | 0.1 | 0.0 | 0.0 | 0.0 | 0.0 | 0.3 | 0.2 | 0.0 | 0.1 | ||
| 1987 | 0.0 | 0.0 | 0.2 | 0.2 | 0.3 | 0.2 | 0.1 | 0.1 | 0.1 | 0.0 | 0.0 | 0.0 | 0.0 | 0.2 | 0.1 | 0.0 | 0.1 | ||
| 1986 | 0.0 | 0.0 | 0.2 | 0.1 | 0.2 | 0.1 | 0.0 | 0.0 | 0.1 | 0.1 | 0.0 | 0.0 | 0.0 | 0.2 | 0.1 | 0.1 | 0.1 | ||
| 1985 | 0.0 | 0.0 | 0.0 | 0.1 | 0.1 | 0.1 | 0.0 | 0.1 | 0.1 | 0.0 | 0.0 | 0.0 | 0.0 | 0.1 | 0.1 | 0.0 | 0.1 | ||
| 1984 | 0.0 | 0.0 | 0.0 | 0.0 | 0.0 | 0.0 | 0.0 | 0.0 | 0.0 | 0.0 | 0.0 | 0.0 | 0.0 | 0.0 | 0.0 | 0.0 | 0.0 | ||
| 1983 | 0.0 | 0.0 | 0.0 | 0.0 | 0.0 | 0.0 | 0.0 | 0.0 | 0.0 | - | 0.0 | 0.0 | 0.0 | 0.0 | 0.0 | 0.0 | 0.0 | ||
| 1982 | - | 0.2 | - | 0.0 | 0.0 | 0.0 | - | 0.0 | - | 0.0 | - | 0.0 | 0.1 | 0.0 | 0.0 | 0.0 | 0.0 | ||
Reporting rates
Reporting rate is the proportion of all surveys in which the species was present.
Reporting rate by year
This chart shows the reporting rate of Fan-tailed Cuckoo each year between 1982 and 2017. 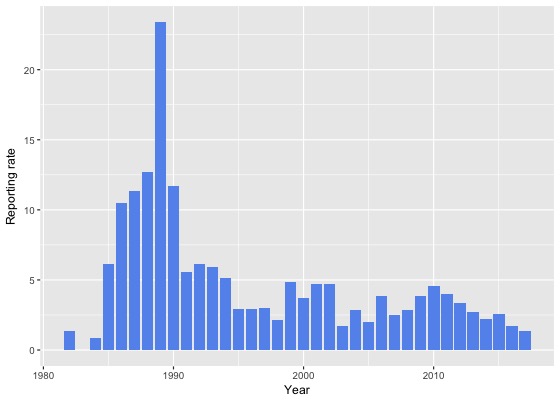
Reporting rate by month
This chart shows the reporting rate by month of Fan-tailed Cuckoo. The blue lines show the reporting rate for the twelve months to June 2017 and the bars show the average reporting rate for the period 1982 to 2017. 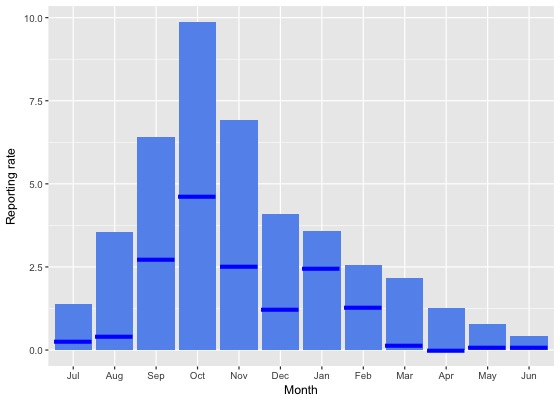
Reporting rate by season
This chart shows the seasonal reporting rate of Fan-tailed Cuckoo. The blue lines show the seasonal reporting rate for the twelve months to June 2017 and the bars show the average seasonal reporting rate for the period 1982 to 2017. 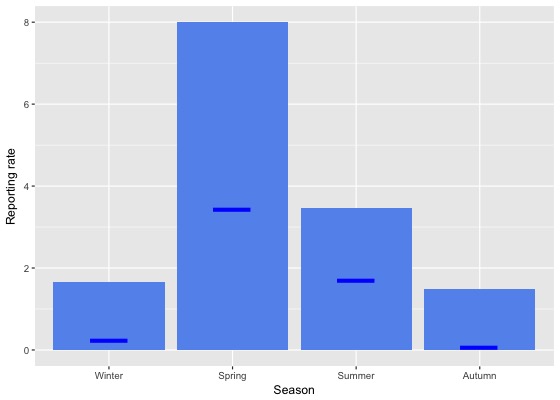
Reporting rate data
| Month | Season | ||||||||||||||||||
|---|---|---|---|---|---|---|---|---|---|---|---|---|---|---|---|---|---|---|---|
| Period | Jul | Aug | Sep | Oct | Nov | Dec | Jan | Feb | Mar | Apr | May | Jun | Winter | Spring | Summer | Autumn | All | ||
| All years | |||||||||||||||||||
| All | 1.4 | 3.5 | 6.4 | 9.9 | 6.9 | 4.1 | 3.6 | 2.5 | 2.2 | 1.3 | 0.8 | 0.4 | 1.6 | 8.0 | 3.5 | 1.5 | 3.9 | ||
| Previous years | |||||||||||||||||||
| All previous years | 1.6 | 4.2 | 6.9 | 10.6 | 7.6 | 4.5 | 3.8 | 2.8 | 2.5 | 1.5 | 0.9 | 0.5 | 1.9 | 8.6 | 3.8 | 1.7 | 4.4 | ||
| Previous 30 years | 1.6 | 4.2 | 6.8 | 10.6 | 7.5 | 4.5 | 3.8 | 2.8 | 2.4 | 1.4 | 0.9 | 0.5 | 1.9 | 8.6 | 3.8 | 1.7 | 4.3 | ||
| Previous 20 years | 1.3 | 2.2 | 4.6 | 9.1 | 3.8 | 2.0 | 2.2 | 1.9 | 1.4 | 1.1 | 0.5 | 0.3 | 1.1 | 6.4 | 2.1 | 1.1 | 2.9 | ||
| 10 year groups | |||||||||||||||||||
| [2007,2017) | 0.9 | 1.5 | 3.6 | 8.9 | 2.6 | 1.5 | 2.2 | 2.1 | 1.3 | 1.2 | 0.3 | 0.3 | 0.8 | 5.9 | 1.9 | 1.0 | 2.7 | ||
| [1997,2007) | 1.9 | 3.8 | 6.7 | 10.0 | 6.1 | 3.0 | 2.5 | 1.4 | 1.7 | 0.9 | 0.9 | 0.4 | 1.8 | 7.6 | 2.4 | 1.2 | 3.5 | ||
| [1987,1997) | 2.7 | 10.1 | 18.3 | 19.3 | 20.0 | 18.3 | 12.8 | 6.9 | 8.2 | 3.2 | 2.5 | 1.4 | 5.0 | 19.2 | 12.9 | 4.7 | 10.9 | ||
| 5 year groups | |||||||||||||||||||
| [2012,2017) | 0.9 | 1.3 | 3.2 | 8.2 | 2.1 | 1.4 | 2.3 | 1.6 | 1.3 | 1.0 | 0.1 | 0.2 | 0.7 | 5.1 | 1.8 | 0.9 | 2.3 | ||
| [2007,2012) | 0.8 | 2.3 | 4.6 | 9.9 | 4.2 | 1.7 | 1.6 | 4.3 | 1.2 | 1.7 | 0.9 | 0.4 | 0.9 | 7.4 | 2.2 | 1.4 | 3.6 | ||
| [2002,2007) | 2.0 | 3.6 | 5.1 | 9.1 | 6.1 | 2.4 | 1.4 | 1.7 | 1.2 | 0.7 | 0.6 | 0.4 | 1.7 | 6.8 | 1.9 | 0.9 | 3.0 | ||
| [1997,2002) | 1.6 | 4.0 | 8.6 | 11.2 | 6.1 | 3.8 | 3.7 | 1.2 | 2.3 | 1.0 | 1.3 | 0.4 | 1.8 | 8.6 | 3.0 | 1.6 | 4.0 | ||
| [1992,1997) | 1.5 | 4.2 | 6.9 | 7.5 | 8.9 | 3.8 | 5.4 | 3.9 | 3.2 | 1.8 | 1.6 | 1.0 | 2.3 | 7.8 | 4.5 | 2.2 | 4.4 | ||
| [1987,1992) | 3.2 | 13.4 | 23.6 | 25.8 | 25.2 | 24.6 | 16.9 | 8.1 | 11.2 | 3.9 | 2.9 | 1.7 | 6.4 | 25.0 | 16.7 | 6.0 | 14.2 | ||
| Year | |||||||||||||||||||
| 2017 | 0.3 | 0.4 | 2.7 | 4.6 | 2.5 | 1.2 | 2.5 | 1.3 | 0.1 | 0.0 | 0.1 | 0.1 | 0.2 | 3.4 | 1.7 | 0.1 | 1.4 | ||
| 2016 | 0.6 | 0.6 | 2.8 | 6.6 | 1.3 | 0.1 | 1.8 | 1.9 | 1.5 | 0.3 | 0.0 | 0.0 | 0.4 | 4.0 | 1.4 | 0.7 | 1.7 | ||
| 2015 | 0.0 | 2.5 | 5.7 | 8.5 | 1.7 | 1.5 | 2.5 | 1.7 | 2.1 | 1.2 | 0.0 | 0.0 | 0.7 | 5.7 | 2.0 | 1.2 | 2.6 | ||
| 2014 | 1.2 | 1.3 | 2.3 | 8.8 | 1.9 | 1.8 | 1.7 | 1.0 | 0.4 | 1.0 | 0.4 | 0.3 | 0.8 | 5.4 | 1.5 | 0.6 | 2.2 | ||
| 2013 | 3.2 | 0.9 | 2.2 | 9.4 | 4.1 | 1.5 | 3.2 | 1.2 | 0.8 | 0.2 | 0.0 | 0.4 | 1.4 | 5.8 | 2.1 | 0.4 | 2.7 | ||
| 2012 | 1.2 | 1.6 | 1.5 | 9.2 | 2.5 | 3.5 | 3.1 | 2.0 | 1.2 | 3.3 | 0.5 | 0.9 | 1.2 | 5.5 | 3.0 | 1.9 | 3.3 | ||
| 2011 | 4.1 | 5.6 | 3.5 | 12.1 | 3.6 | 0.3 | 3.8 | 4.6 | 1.6 | 3.4 | 2.2 | 0.0 | 2.0 | 8.2 | 2.7 | 2.4 | 4.0 | ||
| 2010 | 0.0 | 3.5 | 5.2 | 12.8 | 5.3 | 2.5 | 0.0 | 3.5 | 2.0 | 3.4 | 0.0 | 1.9 | 1.9 | 9.0 | 1.8 | 2.2 | 4.6 | ||
| 2009 | 0.0 | 0.0 | 2.6 | 10.5 | 6.7 | 2.1 | 1.3 | 7.5 | 0.5 | 0.8 | 0.0 | 0.0 | 0.0 | 7.6 | 3.3 | 0.5 | 3.8 | ||
| 2008 | 0.0 | 0.0 | 4.9 | 7.4 | 2.7 | 1.8 | 0.8 | 4.6 | 1.1 | 0.3 | 0.0 | 0.0 | 0.0 | 6.0 | 2.2 | 0.5 | 2.9 | ||
| 2007 | 0.0 | 1.9 | 7.1 | 7.0 | 1.4 | 2.3 | 0.4 | 0.9 | 0.9 | 0.4 | 0.8 | 0.0 | 0.4 | 6.0 | 1.3 | 0.7 | 2.5 | ||
| 2006 | 1.3 | 2.9 | 3.1 | 14.3 | 7.7 | 0.6 | 0.6 | 2.2 | 2.1 | 0.5 | 0.0 | 0.0 | 1.0 | 9.7 | 1.0 | 1.2 | 3.8 | ||
| 2005 | 0.7 | 0.9 | 2.6 | 4.4 | 4.8 | 3.2 | 2.8 | 4.3 | 0.9 | 0.5 | 0.0 | 0.4 | 0.6 | 3.7 | 3.3 | 0.5 | 2.0 | ||
| 2004 | 1.6 | 5.3 | 10.6 | 3.5 | 4.1 | 2.8 | 0.6 | 2.0 | 0.5 | 0.0 | 1.9 | 0.0 | 2.1 | 6.3 | 1.9 | 0.6 | 2.8 | ||
| 2003 | 2.6 | 4.3 | 3.4 | 5.7 | 1.8 | 1.7 | 0.7 | 0.0 | 0.0 | 0.0 | 0.0 | 0.0 | 2.2 | 3.6 | 0.9 | 0.0 | 1.7 | ||
| 2002 | 4.0 | 3.4 | 7.0 | 11.2 | 12.0 | 2.9 | 2.5 | 1.3 | 1.8 | 3.0 | 2.4 | 1.6 | 2.9 | 10.1 | 2.5 | 2.3 | 4.7 | ||
| 2001 | 0.4 | 3.6 | 9.5 | 14.7 | 6.2 | 4.0 | 5.0 | 1.5 | 3.3 | 2.0 | 1.7 | 1.0 | 1.5 | 10.4 | 3.6 | 2.5 | 4.7 | ||
| 2000 | 0.8 | 2.0 | 8.8 | 11.0 | 7.4 | 2.3 | 3.3 | 1.0 | 2.0 | 1.3 | 1.8 | 0.0 | 0.9 | 9.1 | 2.3 | 1.7 | 3.7 | ||
| 1999 | 0.0 | 7.2 | 12.6 | 11.9 | 9.7 | 8.1 | 3.6 | 0.0 | 2.2 | 0.5 | 1.1 | 0.5 | 2.3 | 11.5 | 4.1 | 1.3 | 4.9 | ||
| 1998 | 2.7 | 0.0 | 4.1 | 5.4 | 1.8 | 1.9 | 2.9 | 1.9 | 1.1 | 0.0 | 0.0 | 0.0 | 0.6 | 3.7 | 2.2 | 0.6 | 2.2 | ||
| 1997 | 5.7 | 8.6 | 3.6 | 6.6 | 2.6 | 2.9 | 2.0 | 3.5 | 0.0 | 0.0 | 0.0 | 0.0 | 4.6 | 4.0 | 2.8 | 0.0 | 3.0 | ||
| 1996 | 0.0 | 4.3 | 2.7 | 3.5 | 6.5 | 4.0 | 2.9 | 1.2 | 2.0 | 3.1 | 0.0 | 2.3 | 2.4 | 4.4 | 2.8 | 1.8 | 2.9 | ||
| 1995 | 0.0 | 3.1 | 4.9 | 3.0 | 8.2 | 5.7 | 2.7 | 3.2 | 3.1 | 0.8 | 0.0 | 0.0 | 1.3 | 5.0 | 3.8 | 1.3 | 2.9 | ||
| 1994 | 7.8 | 5.2 | 7.4 | 11.6 | 5.9 | 6.5 | 8.8 | 5.2 | 2.3 | 1.5 | 1.2 | 2.2 | 4.6 | 7.9 | 7.0 | 1.7 | 5.1 | ||
| 1993 | 0.0 | 6.4 | 8.1 | 12.0 | 12.1 | 0.0 | 12.2 | 3.1 | 6.2 | 3.3 | 3.9 | 0.0 | 2.6 | 10.8 | 5.5 | 4.6 | 5.9 | ||
| 1992 | 1.5 | 1.9 | 11.8 | 12.8 | 16.7 | 1.6 | 5.2 | 9.8 | 2.8 | 1.7 | 2.6 | 0.0 | 1.1 | 13.5 | 4.9 | 2.4 | 6.1 | ||
| 1991 | 2.4 | 7.4 | 5.8 | 10.7 | 13.4 | 6.8 | 1.8 | 6.0 | 4.8 | 0.0 | 0.0 | 0.0 | 3.7 | 10.1 | 5.0 | 1.6 | 5.5 | ||
| 1990 | 7.1 | 10.8 | 17.2 | 15.3 | 22.4 | 22.2 | 16.7 | 9.9 | 6.8 | 2.4 | 5.5 | 5.3 | 8.4 | 18.5 | 16.3 | 4.9 | 11.7 | ||
| 1989 | 4.6 | 24.1 | 40.6 | 41.9 | 30.8 | 36.5 | 27.1 | 11.9 | 20.0 | 11.3 | 9.2 | 4.8 | 12.2 | 38.3 | 25.8 | 13.7 | 23.4 | ||
| 1988 | 0.0 | 8.6 | 21.3 | 30.1 | 25.6 | 21.5 | 19.6 | 6.3 | 9.4 | 1.6 | 1.0 | 0.0 | 3.3 | 26.1 | 16.2 | 4.1 | 12.7 | ||
| 1987 | 0.0 | 0.0 | 18.2 | 15.2 | 26.0 | 21.3 | 8.7 | 6.2 | 9.1 | 1.2 | 0.4 | 0.0 | 0.0 | 20.4 | 11.9 | 3.4 | 11.3 | ||
| 1986 | 0.0 | 2.6 | 20.8 | 11.1 | 23.4 | 14.7 | 4.3 | 2.8 | 16.1 | 7.8 | 6.9 | 2.9 | 2.0 | 19.1 | 7.5 | 9.9 | 10.5 | ||
| 1985 | 0.0 | 3.3 | 3.8 | 9.3 | 10.5 | 6.7 | 0.0 | 11.8 | 18.2 | 0.0 | 0.0 | 0.0 | 1.1 | 8.2 | 7.1 | 5.0 | 6.1 | ||
| 1984 | 0.0 | 0.0 | 0.0 | 0.0 | 0.0 | 0.0 | 3.4 | 0.0 | 0.0 | 2.9 | 0.0 | 0.0 | 0.0 | 0.0 | 1.4 | 1.1 | 0.8 | ||
| 1983 | 0.0 | 0.0 | 0.0 | 0.0 | 0.0 | 0.0 | 0.0 | 0.0 | 0.0 | - | 0.0 | 0.0 | 0.0 | 0.0 | 0.0 | 0.0 | 0.0 | ||
| 1982 | - | 9.1 | - | 0.0 | 0.0 | 0.0 | - | 0.0 | - | 0.0 | - | 0.0 | 4.0 | 0.0 | 0.0 | 0.0 | 1.4 | ||
Breeding data
Breeding records by month
Number of breeding records by breeding code and month, 2017 and all years| Breeding code | Jul | Aug | Sep | Oct | Nov | Dec | Jan | Feb | Mar | Apr | May | Jun |
|---|---|---|---|---|---|---|---|---|---|---|---|---|
| 2017 | ||||||||||||
| Breeding (BLA code) | 0 | 0 | 0 | 0 | 0 | 0 | 0 | 0 | 0 | 0 | 0 | 0 |
| Carrying Food | 0 | 0 | 0 | 0 | 0 | 0 | 0 | 0 | 0 | 0 | 0 | 0 |
| Copulating | 0 | 0 | 0 | 0 | 0 | 0 | 0 | 0 | 0 | 0 | 0 | 0 |
| Display | 0 | 0 | 0 | 0 | 0 | 0 | 0 | 0 | 0 | 0 | 0 | 0 |
| Dependent young | 0 | 0 | 0 | 0 | 0 | 0 | 0 | 0 | 0 | 0 | 0 | 0 |
| Faecal sac | 0 | 0 | 0 | 0 | 0 | 0 | 0 | 0 | 0 | 0 | 0 | 0 |
| Inspecting hollow | 0 | 0 | 0 | 0 | 0 | 0 | 0 | 0 | 0 | 0 | 0 | 0 |
| Nest building | 0 | 0 | 0 | 0 | 0 | 0 | 0 | 0 | 0 | 0 | 0 | 0 |
| Nest with eggs | 0 | 0 | 0 | 0 | 0 | 0 | 0 | 0 | 0 | 0 | 0 | 0 |
| Nest with young | 0 | 0 | 0 | 0 | 0 | 0 | 0 | 0 | 0 | 0 | 0 | 0 |
| On/leaving nest | 0 | 0 | 0 | 0 | 0 | 0 | 0 | 0 | 0 | 0 | 0 | 0 |
| All years | ||||||||||||
| Breeding (BLA code) | 0 | 0 | 0 | 1 | 0 | 2 | 0 | 0 | 0 | 0 | 0 | 0 |
| Carrying Food | 0 | 0 | 0 | 0 | 0 | 0 | 0 | 0 | 0 | 0 | 0 | 0 |
| Copulating | 0 | 0 | 0 | 1 | 0 | 0 | 0 | 0 | 0 | 0 | 0 | 0 |
| Display | 0 | 0 | 1 | 2 | 0 | 0 | 0 | 0 | 0 | 0 | 0 | 0 |
| Dependent young | 0 | 0 | 0 | 1 | 1 | 3 | 7 | 4 | 3 | 0 | 0 | 0 |
| Faecal sac | 0 | 0 | 0 | 0 | 0 | 0 | 0 | 0 | 0 | 0 | 0 | 0 |
| Inspecting hollow | 0 | 0 | 0 | 0 | 0 | 0 | 0 | 0 | 0 | 0 | 0 | 0 |
| Nest building | 0 | 0 | 0 | 0 | 0 | 0 | 2 | 0 | 0 | 0 | 0 | 0 |
| Nest with eggs | 0 | 0 | 0 | 0 | 0 | 0 | 0 | 0 | 0 | 0 | 0 | 0 |
| Nest with young | 0 | 0 | 0 | 0 | 0 | 0 | 0 | 0 | 0 | 0 | 0 | 0 |
| On/leaving nest | 0 | 0 | 0 | 0 | 0 | 0 | 0 | 0 | 0 | 0 | 0 | 0 |
Breeding records by year
Average number of breeding records per period by breeding code| Period | Breeding (BLA code) | Carrying Food | Copulating | Display | Dependent young | Faecal sac | Inspecting hollow | Nest building | Nest with eggs | Nest with young | On/leaving nest |
|---|---|---|---|---|---|---|---|---|---|---|---|
| All years | |||||||||||
| All | 0.1 | 0.0 | 0.0 | 0.1 | 0.5 | 0.0 | 0.0 | 0.1 | 0.0 | 0.0 | 0.0 |
| Previous years | |||||||||||
| All previous years | 0.1 | 0.0 | 0.0 | 0.1 | 0.5 | 0.0 | 0.0 | 0.1 | 0.0 | 0.0 | 0.0 |
| Previous 30 years | 0.1 | 0.0 | 0.0 | 0.1 | 0.6 | 0.0 | 0.0 | 0.1 | 0.0 | 0.0 | 0.0 |
| Previous 20 years | 0.1 | 0.0 | 0.0 | 0.1 | 0.3 | 0.0 | 0.0 | 0.0 | 0.0 | 0.0 | 0.0 |
| 10 year groups | |||||||||||
| [2007,2017) | 0.1 | 0.0 | 0.1 | 0.2 | 0.5 | 0.0 | 0.0 | 0.0 | 0.0 | 0.0 | 0.0 |
| [1997,2007) | 0.2 | 0.0 | 0.0 | 0.1 | 0.1 | 0.0 | 0.0 | 0.0 | 0.0 | 0.0 | 0.0 |
| [1987,1997) | 0.0 | 0.0 | 0.0 | 0.0 | 1.3 | 0.0 | 0.0 | 0.2 | 0.0 | 0.0 | 0.0 |
| 5 year groups | |||||||||||
| [2012,2017) | 0.2 | 0.0 | 0.0 | 0.2 | 1.0 | 0.0 | 0.0 | 0.0 | 0.0 | 0.0 | 0.0 |
| [2007,2012) | 0.0 | 0.0 | 0.2 | 0.2 | 0.0 | 0.0 | 0.0 | 0.0 | 0.0 | 0.0 | 0.0 |
| [2002,2007) | 0.2 | 0.0 | 0.0 | 0.0 | 0.2 | 0.0 | 0.0 | 0.0 | 0.0 | 0.0 | 0.0 |
| [1997,2002) | 0.2 | 0.0 | 0.0 | 0.2 | 0.0 | 0.0 | 0.0 | 0.0 | 0.0 | 0.0 | 0.0 |
| [1992,1997) | 0.0 | 0.0 | 0.0 | 0.0 | 0.0 | 0.0 | 0.0 | 0.0 | 0.0 | 0.0 | 0.0 |
| [1987,1992) | 0.0 | 0.0 | 0.0 | 0.0 | 2.6 | 0.0 | 0.0 | 0.4 | 0.0 | 0.0 | 0.0 |
| Year | |||||||||||
| 2017 | 0.0 | 0.0 | 0.0 | 0.0 | 0.0 | 0.0 | 0.0 | 0.0 | 0.0 | 0.0 | 0.0 |
| 2016 | 0.0 | 0.0 | 0.0 | 1.0 | 3.0 | 0.0 | 0.0 | 0.0 | 0.0 | 0.0 | 0.0 |
| 2015 | 0.0 | 0.0 | 0.0 | 0.0 | 2.0 | 0.0 | 0.0 | 0.0 | 0.0 | 0.0 | 0.0 |
| 2014 | 0.0 | 0.0 | 0.0 | 0.0 | 0.0 | 0.0 | 0.0 | 0.0 | 0.0 | 0.0 | 0.0 |
| 2013 | 1.0 | 0.0 | 0.0 | 0.0 | 0.0 | 0.0 | 0.0 | 0.0 | 0.0 | 0.0 | 0.0 |
| 2012 | 0.0 | 0.0 | 0.0 | 0.0 | 0.0 | 0.0 | 0.0 | 0.0 | 0.0 | 0.0 | 0.0 |
| 2011 | 0.0 | 0.0 | 0.0 | 1.0 | 0.0 | 0.0 | 0.0 | 0.0 | 0.0 | 0.0 | 0.0 |
| 2010 | 0.0 | 0.0 | 0.0 | 0.0 | 0.0 | 0.0 | 0.0 | 0.0 | 0.0 | 0.0 | 0.0 |
| 2009 | 0.0 | 0.0 | 0.0 | 0.0 | 0.0 | 0.0 | 0.0 | 0.0 | 0.0 | 0.0 | 0.0 |
| 2008 | 0.0 | 0.0 | 1.0 | 0.0 | 0.0 | 0.0 | 0.0 | 0.0 | 0.0 | 0.0 | 0.0 |
| 2007 | 0.0 | 0.0 | 0.0 | 0.0 | 0.0 | 0.0 | 0.0 | 0.0 | 0.0 | 0.0 | 0.0 |
| 2006 | 0.0 | 0.0 | 0.0 | 0.0 | 0.0 | 0.0 | 0.0 | 0.0 | 0.0 | 0.0 | 0.0 |
| 2005 | 0.0 | 0.0 | 0.0 | 0.0 | 0.0 | 0.0 | 0.0 | 0.0 | 0.0 | 0.0 | 0.0 |
| 2004 | 0.0 | 0.0 | 0.0 | 0.0 | 1.0 | 0.0 | 0.0 | 0.0 | 0.0 | 0.0 | 0.0 |
| 2003 | 0.0 | 0.0 | 0.0 | 0.0 | 0.0 | 0.0 | 0.0 | 0.0 | 0.0 | 0.0 | 0.0 |
| 2002 | 1.0 | 0.0 | 0.0 | 0.0 | 0.0 | 0.0 | 0.0 | 0.0 | 0.0 | 0.0 | 0.0 |
| 2001 | 0.0 | 0.0 | 0.0 | 0.0 | 0.0 | 0.0 | 0.0 | 0.0 | 0.0 | 0.0 | 0.0 |
| 2000 | 0.0 | 0.0 | 0.0 | 0.0 | 0.0 | 0.0 | 0.0 | 0.0 | 0.0 | 0.0 | 0.0 |
| 1999 | 1.0 | 0.0 | 0.0 | 1.0 | 0.0 | 0.0 | 0.0 | 0.0 | 0.0 | 0.0 | 0.0 |
| 1998 | 0.0 | 0.0 | 0.0 | 0.0 | 0.0 | 0.0 | 0.0 | 0.0 | 0.0 | 0.0 | 0.0 |
| 1997 | 0.0 | 0.0 | 0.0 | 0.0 | 0.0 | 0.0 | 0.0 | 0.0 | 0.0 | 0.0 | 0.0 |
| 1996 | 0.0 | 0.0 | 0.0 | 0.0 | 0.0 | 0.0 | 0.0 | 0.0 | 0.0 | 0.0 | 0.0 |
| 1995 | 0.0 | 0.0 | 0.0 | 0.0 | 0.0 | 0.0 | 0.0 | 0.0 | 0.0 | 0.0 | 0.0 |
| 1994 | 0.0 | 0.0 | 0.0 | 0.0 | 0.0 | 0.0 | 0.0 | 0.0 | 0.0 | 0.0 | 0.0 |
| 1993 | 0.0 | 0.0 | 0.0 | 0.0 | 0.0 | 0.0 | 0.0 | 0.0 | 0.0 | 0.0 | 0.0 |
| 1992 | 0.0 | 0.0 | 0.0 | 0.0 | 0.0 | 0.0 | 0.0 | 0.0 | 0.0 | 0.0 | 0.0 |
| 1991 | 0.0 | 0.0 | 0.0 | 0.0 | 0.0 | 0.0 | 0.0 | 0.0 | 0.0 | 0.0 | 0.0 |
| 1990 | 0.0 | 0.0 | 0.0 | 0.0 | 3.0 | 0.0 | 0.0 | 0.0 | 0.0 | 0.0 | 0.0 |
| 1989 | 0.0 | 0.0 | 0.0 | 0.0 | 3.0 | 0.0 | 0.0 | 2.0 | 0.0 | 0.0 | 0.0 |
| 1988 | 0.0 | 0.0 | 0.0 | 0.0 | 3.0 | 0.0 | 0.0 | 0.0 | 0.0 | 0.0 | 0.0 |
| 1987 | 0.0 | 0.0 | 0.0 | 0.0 | 4.0 | 0.0 | 0.0 | 0.0 | 0.0 | 0.0 | 0.0 |
| 1986 | 0.0 | 0.0 | 0.0 | 0.0 | 0.0 | 0.0 | 0.0 | 0.0 | 0.0 | 0.0 | 0.0 |
| 1985 | 0.0 | 0.0 | 0.0 | 0.0 | 0.0 | 0.0 | 0.0 | 0.0 | 0.0 | 0.0 | 0.0 |
| 1984 | 0.0 | 0.0 | 0.0 | 0.0 | 0.0 | 0.0 | 0.0 | 0.0 | 0.0 | 0.0 | 0.0 |
| 1983 | 0.0 | 0.0 | 0.0 | 0.0 | 0.0 | 0.0 | 0.0 | 0.0 | 0.0 | 0.0 | 0.0 |
| 1982 | 0.0 | 0.0 | 0.0 | 0.0 | 0.0 | 0.0 | 0.0 | 0.0 | 0.0 | 0.0 | 0.0 |
Distribution map
Distribution - 2017
This map shows the observed distribution of the Fan-tailed Cuckoo for 2017.
The red circles are the grid cells where Fan-tailed Cuckoo have been reported.
The transparency of the red circles indicate how many surveys sheets were submitted for that grid cell; the darker the red the more reliable the data. Of the 315 grid cells with reports, 83 had only one sheet; an example is grid number D22.
The size of the circle represents the reporting rate. The maximum reporting rate for Fan-tailed Cuckoo was 100.0% (eg grid number D21) and the minimum was 0.1% (eg grid number L14). 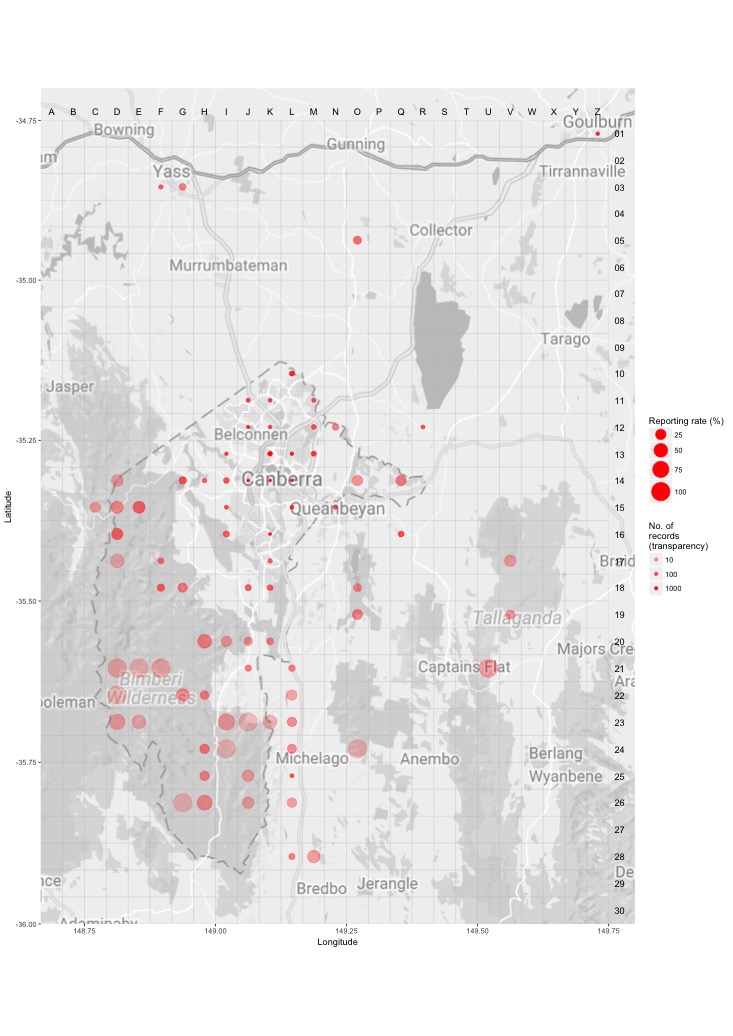
Distribution - all years
This map shows the observed distribution of the Fan-tailed Cuckoo for all years.
The red circles are the grid cells where Fan-tailed Cuckoo have been reported.
The transparency of the red circles indicate how many surveys sheets were submitted for that grid cell; the darker the red the more reliable the data. Of the 703 grid cells with reports, 55 had only one sheet; an example is grid number A5.
The size of the circle represents the reporting rate. The maximum reporting rate for Fan-tailed Cuckoo was 100.0% (eg grid number A5) and the minimum was 0.2% (eg grid number L12). 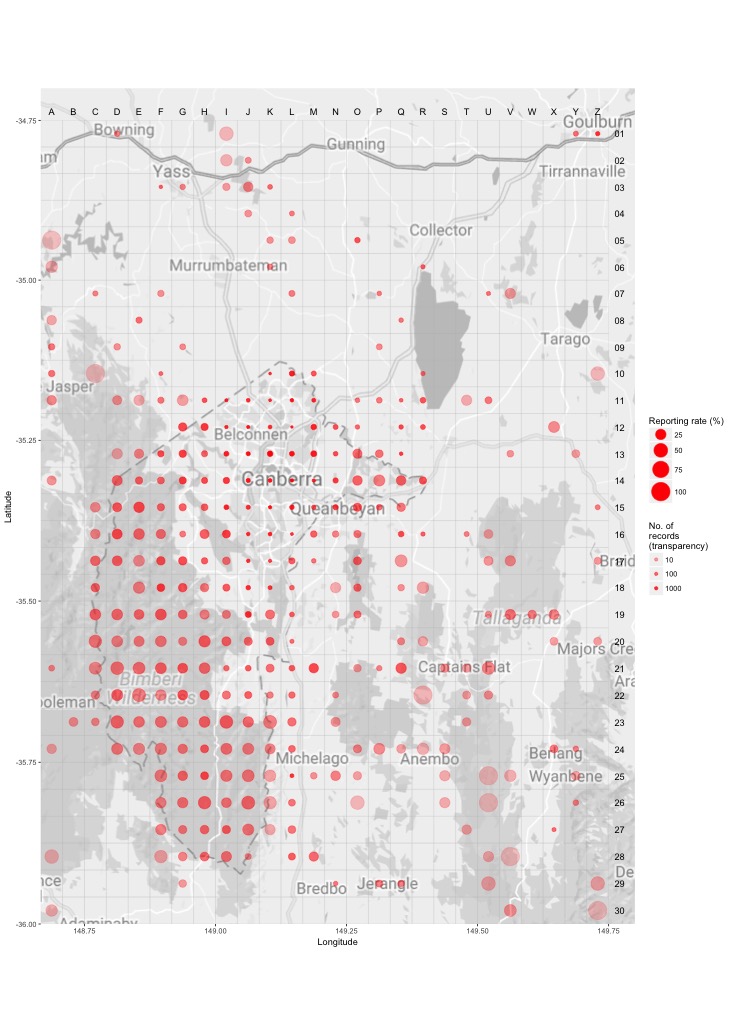
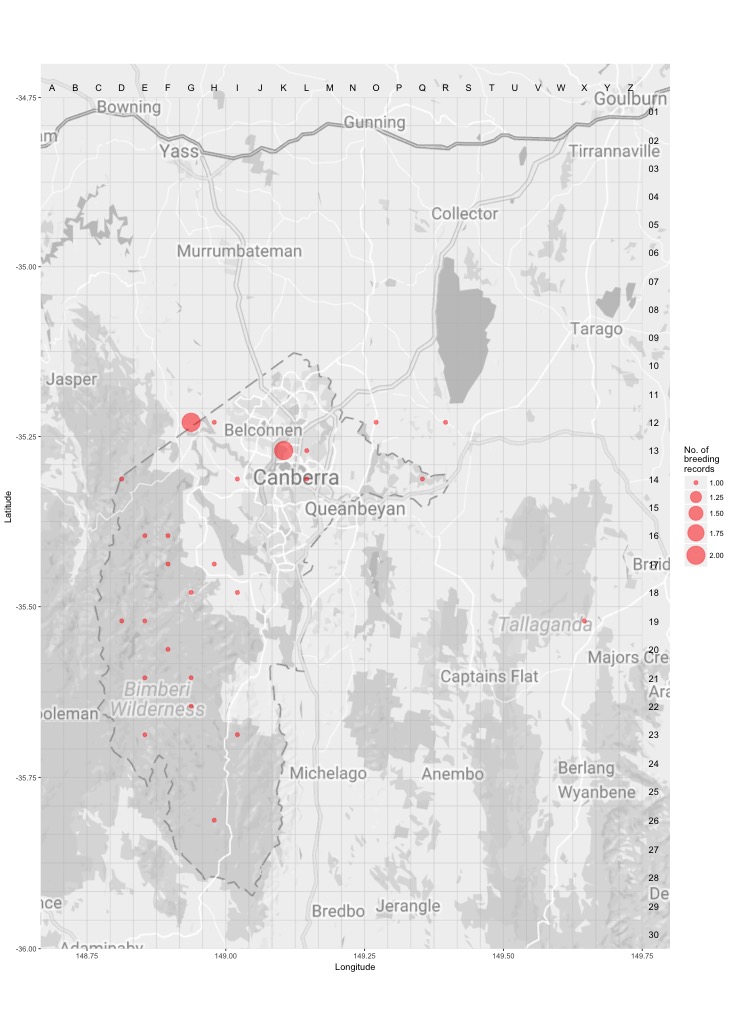
Breeding map
Breeding - 2017
This map shows the breeding distribution of the Fan-tailed Cuckoo for 2017.
The red circles are the grid cells where breeding activity for Fan-tailed Cuckoo have been reported.
The size of the circle represents the number of reports. 
Breeding - all years
This map shows the breeding distribution of the Fan-tailed Cuckoo for all years.
The red circles are the grid cells where breeding activity for Fan-tailed Cuckoo have been reported.
The size of the circle represents the number of reports.